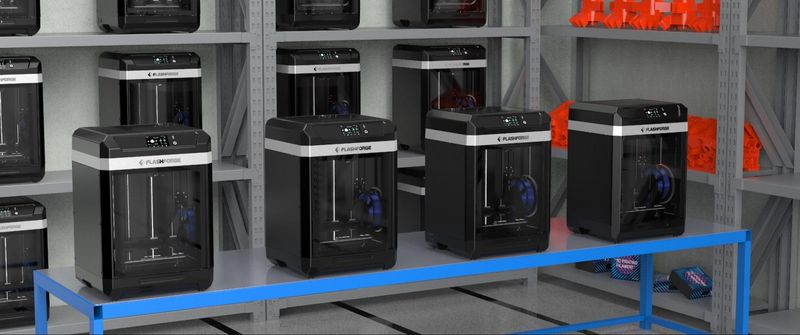
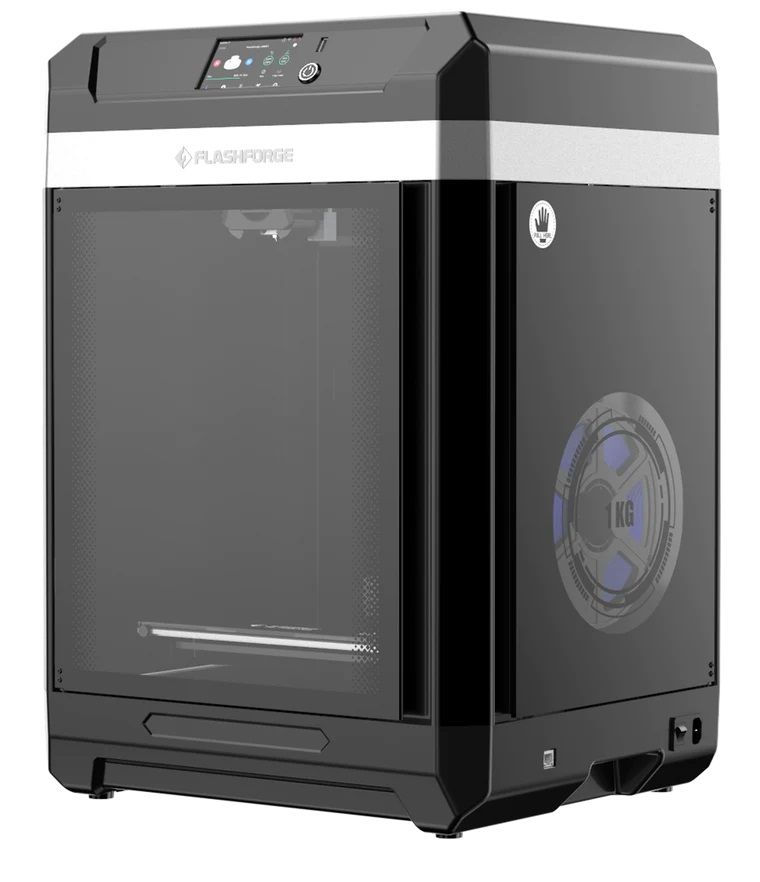
La Flashforge Guider 3 es una impresora 3D FDM de sobremesa con un amplio volumen de construcción y una gran cantidad de funciones útiles, dirigida al mercado profesional. Con una impresionante velocidad de impresión de hasta 250 mm/s, el dispositivo es ideal para las necesidades de fabricación rentable de pequeños lotes de pequeñas y medianas empresas. Con su rígido bastidor de aluminio y las ligeras pero duraderas láminas acrílicas y de ABS de la carcasa, la Guider 3 garantiza la estabilidad de la impresión incluso tras largas horas de funcionamiento continuo. Su peso reducido y su tamaño compacto permiten integrar perfectamente la impresora en cualquier entorno de producción.
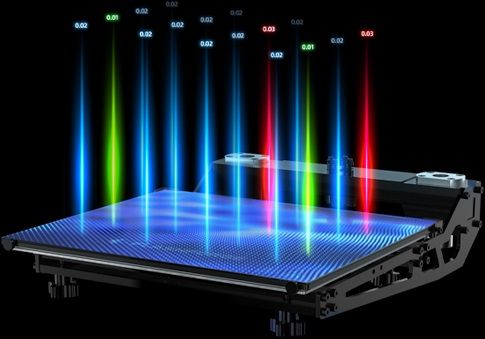
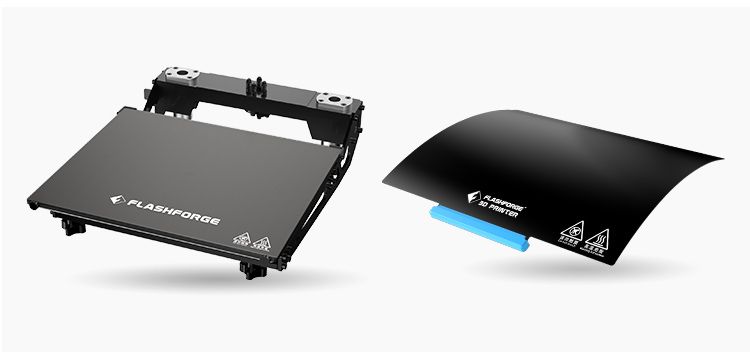
La impresora está equipada con una placa de impresión de cristal calefactada que puede cambiarse fácilmente por una lámina de acero flexible magnética que también viene con la Guider 3. Esta flexibilidad permite la elección óptima de la superficie de impresión en función del tipo de filamento, el tamaño del modelo y otros parámetros. El Guider 3 está equipado con nivelación automática y auxiliar de la cama que utiliza un sensor de proximidad inductivo de alta sensibilidad para garantizar el ajuste preciso de la altura del eje Z para una correcta adhesión de las capas.
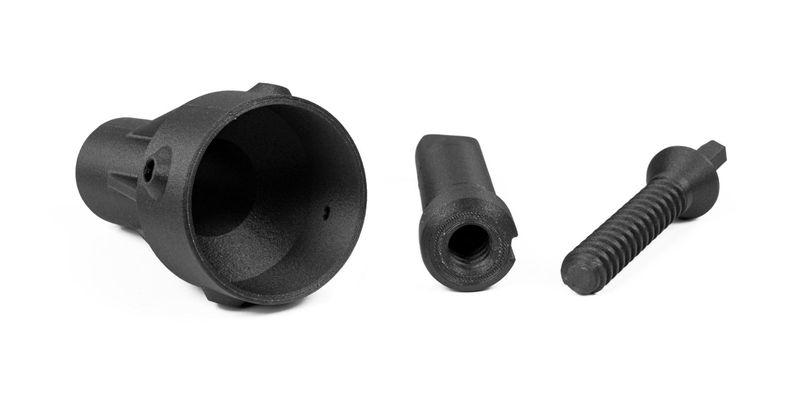
En comparación con las Guider II anteriores, la extrusora de doble engranaje proporciona una fuerza de alimentación de filamento un 150% mayor para evitar problemas de obstrucción. Está equipada con una boquilla de liberación rápida que puede cambiarse fácilmente por una opción de diámetro diferente si es necesario. Entre otras características destacables de la Guider 3, se encuentran el sensor de detección de filamento, el apagado automático cuando finaliza el trabajo de impresión, la activación del modo de reposo si no se utiliza durante mucho tiempo y la filtración eficaz del aire con un filtro HEPA 13 integrado.
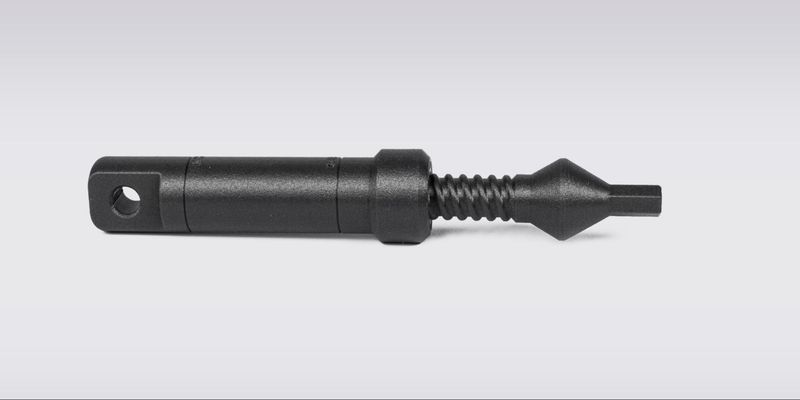
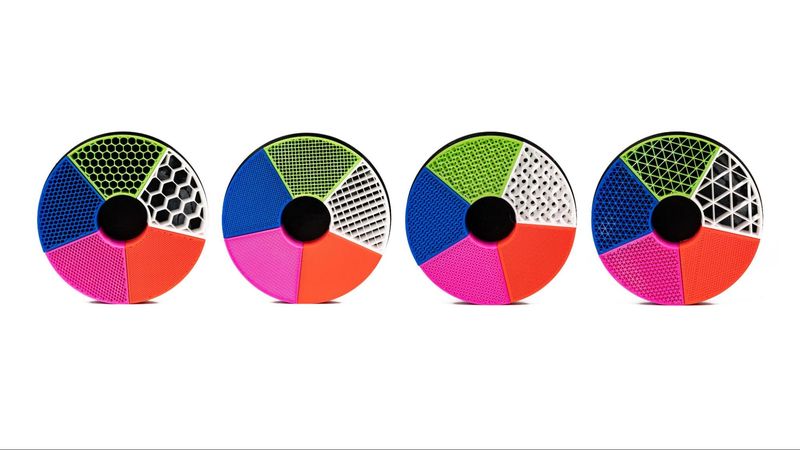
El extrusor Guider 3 está equipado con una boquilla de acero inoxidable que puede calentarse hasta 320 °C. Esto permite imprimir con una gran variedad de filamentos, incluidos materiales reforzados y de alta temperatura. La placa de impresión calentada y la cámara de impresión cerrada reducen los problemas de impresión, como el alabeo o la delaminación, especialmente al imprimir con plásticos de tipo ABS. Con una altura de capa mínima de 50 micras, la Guider 3 es capaz de fabricar piezas de alta calidad con un acabado superficial suave.
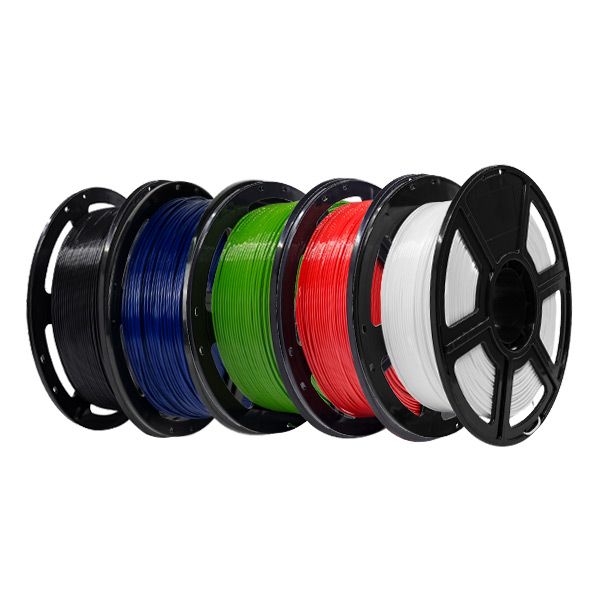
La impresora es compatible con una amplia gama de termoplásticos, como ABS, PLA, PC, PA, HIPS, ASA, PETG, PA-CF, PLA-CF, PETG-CF, PETG-GF y otros. La máquina es un sistema de material abierto, lo que hace que la elección de filamentos sea literalmente ilimitada.
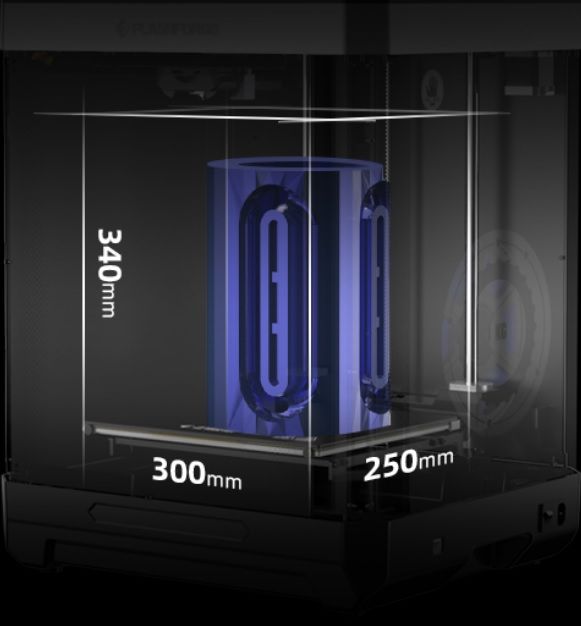
El volumen de construcción del Flashforge Guider 3 es de 300 x 250 x 340 mm, lo que es suficiente para la fabricación de lotes pequeños o la construcción de piezas bastante grandes.
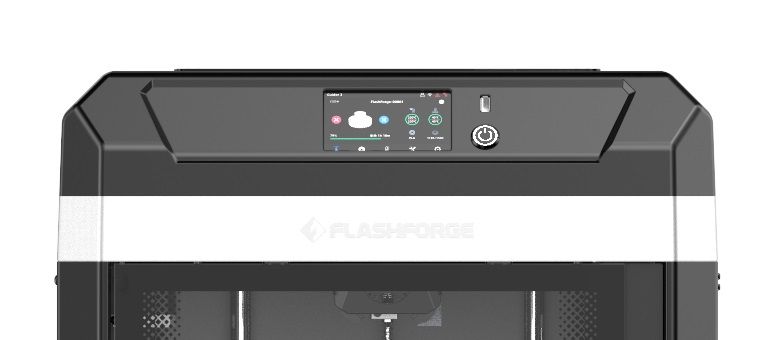
Gracias a la pantalla táctil LCD de 4,3" con una interfaz de usuario intuitiva y bien organizada, el usuario tiene un acceso rápido y cómodo a todos los ajustes y parámetros de la impresora. El dispositivo dispone de conectividad Wi-Fi y Ethernet, así como de una ranura USB para transferir las tareas de impresión del PC a la impresora en una memoria USB.
Para desarrollar el concepto de impresión continua de calidad industrial, la Guider 3 incorpora un eficaz sistema de gestión. Permite al usuario controlar varios dispositivos simultáneamente y reanudar automáticamente la impresión tras un corte de corriente. La cámara integrada permite supervisar el proceso de impresión en tiempo real.
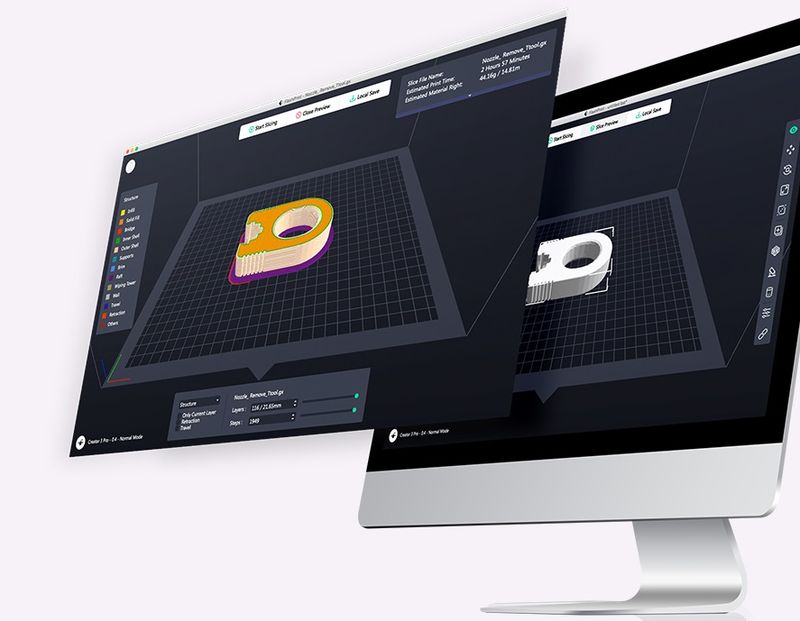
La máquina incluye el software de corte Flashprint 5, con un potente conjunto de funciones y una interfaz renovada y fácil de usar. Otras cortadoras compatibles son Slic3r y Cura.
Para algunos artículos, el contenido del paquete puede cambiar. Si tiene alguna duda, póngase en contacto con nosotros..
La impresora 3D FDM Flashforge Guider 3 está disponible en color negro. Su aspecto elegante y su diseño compacto la hacen ideal para cualquier estudio, pequeña empresa o instituto educativo.
Las dimensiones de la máquina son 496 x 436 x 696 mm (19,5 x 17,2 x 27,4 pulgadas). Pesa aproximadamente 27 kg (59,5 lb).
Para conocer el precio actual del Flashforge Guider 3, haga clic en el botón "solicitar presupuesto" y rellene el formulario. Nos pondremos en contacto con usted lo antes posible y le enviaremos todos los detalles.
Update your browser to view this website correctly. Update my browser now

